Rail Draw Influences on Sprint Performances at Varied Flat Venues
Dana Fischer · Aug 23, 2026
Rail Draw Influences on Sprint Performances at Varied Flat Venues
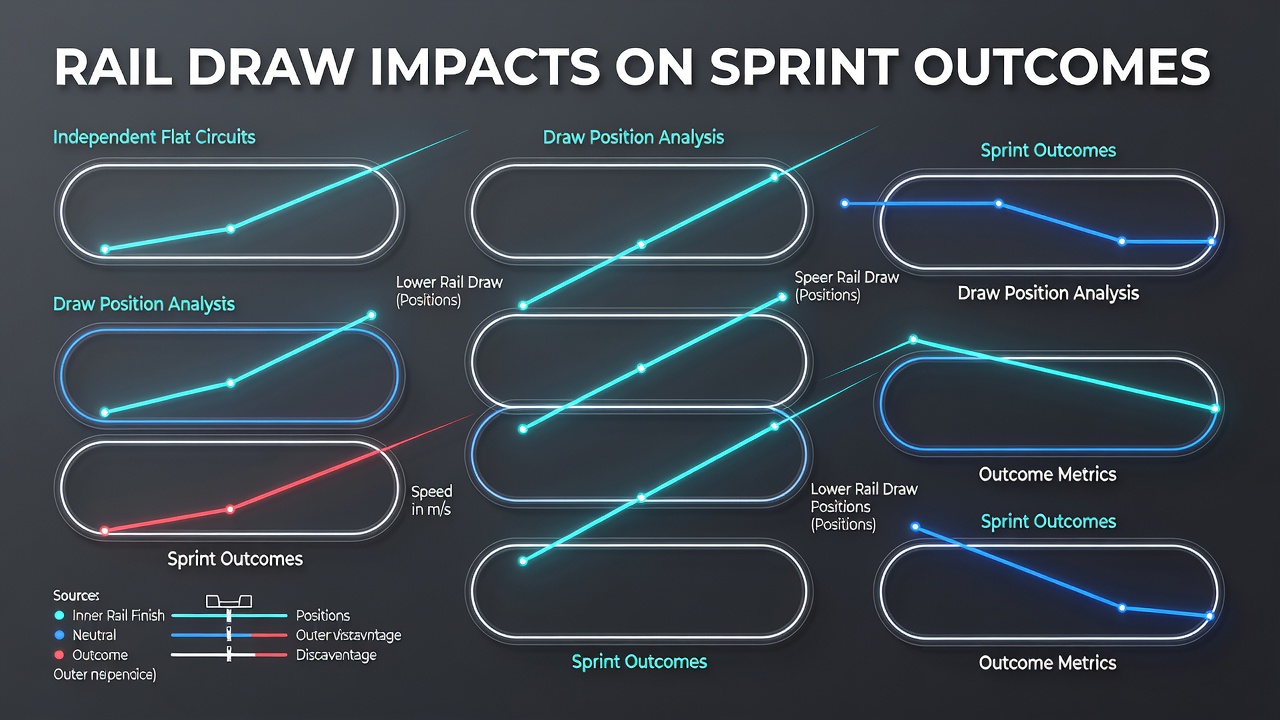
Flat racing circuits present distinct challenges when rail draw positions shape sprint outcomes, and data collected from independent tracks reveals consistent patterns tied to course geometry and surface conditions. Observers note that inside draws often shorten the effective distance run to the first turn, while wider posts force horses into longer paths that demand extra energy early in the race. Researchers have compiled results from multiple venues to map these effects, and the patterns hold across seasons when adjusted for field size and pace scenarios.
Core Mechanics Behind Draw Biases
Track layouts dictate how draw position translates into advantage or disadvantage, because the rail itself creates a measurable distance differential from start to the initial bend. Studies conducted on circuits with tight turns show that post-one horses cover up to three metres less ground than those drawn wide in five-furlong contests, and that gap widens on sharper configurations. Analysts cross-reference official going reports with sectional timing data, and the resulting figures indicate that low-drawn runners maintain higher average speeds into the straight when the ground rides true. Yet on tracks with pronounced cambers the inside path can lose its edge once the surface firms, because horses must negotiate a steeper gradient while still accelerating.
Evidence from Separate Racing Jurisdictions
Records compiled by Racing Australia across several provincial ovals demonstrate that inside draws win at rates above expected value in sprints under 1200 metres when the rail remains in its true position. Similar datasets from North American tracks highlight how synthetic surfaces reduce the draw premium, since the uniform cushioning diminishes the impact of path length. European circuits with turf surfaces exhibit more variable outcomes, and observers attribute the difference to seasonal rainfall that alters footing near the rail versus the centre of the track. August 2026 figures from a multi-track study released by the Jockey Club of Canada further confirmed that draw advantages shift measurably when maintenance crews move the rail outward by several metres during summer meetings.
Those who examine pace maps alongside draw statistics find that early leaders drawn inside sustain their position more readily, whereas wide-drawn speed horses expend additional effort simply to reach the turn on equal terms. This interaction between draw and running style appears most pronounced in fields exceeding ten runners, because traffic congestion amplifies any initial distance deficit.
Comparative Analysis Across Circuits
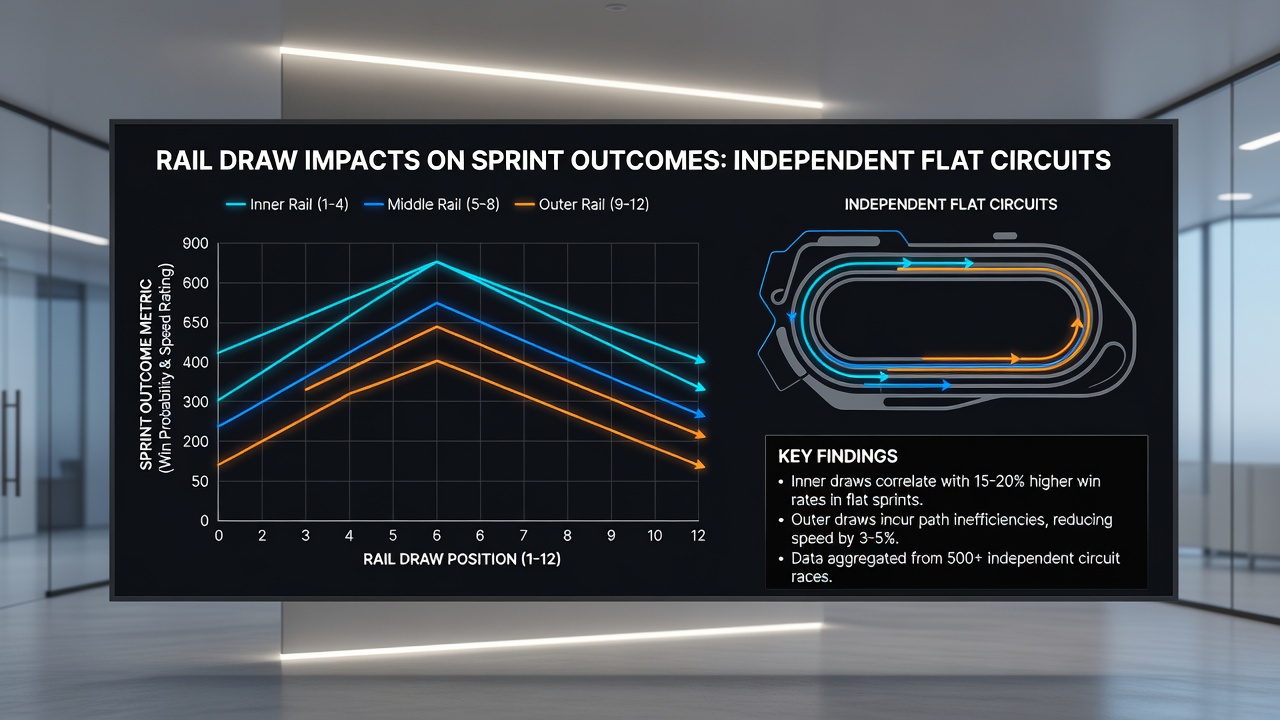
Independent flat venues differ in straight length, turn radius and surface composition, and each variable modulates the practical value of a given draw. Short straight tracks compress the advantage into the opening furlong, while longer straights allow wide-drawn horses time to recover lost ground before the finish line. Data aggregated from three continents shows that the inside bias peaks on circuits measuring under 1000 metres from start to finish, then declines steadily as race distance increases toward 1400 metres. Handicappers who adjust raw draw statistics for these track-specific traits produce more accurate probability estimates than those who apply a single universal model.
One study released in 2025 by an academic team at the University of Melbourne tracked 2,400 sprint races and isolated the contribution of rail position after controlling for horse ability and trainer patterns. The results indicated a statistically significant edge for the lowest three draws on left-handed tracks with tight bends, while right-handed venues displayed a milder inside premium that disappeared once the ground became soft. Follow-up work scheduled for release in late 2026 aims to incorporate real-time GPS data so that actual path lengths can replace estimated distances.
Practical Applications for Race Analysis
Trainers and owners review draw statistics when planning campaign targets, because certain circuits reward inside posts more reliably than others. Jockeys who ride regularly at a given venue learn to adjust their early positioning based on post number, and those adjustments compound over multiple meetings. Statistical services now publish draw tables updated after each meeting, and the latest versions include filters for going, field size and rail movement. These resources allow direct comparison between current conditions and historical benchmarks drawn from the same track.
International comparisons further illustrate that synthetic and dirt surfaces flatten draw effects relative to turf, since the evenness of the going reduces the penalty for running wide. Australian and North American data converge on this point, whereas turf circuits in cooler climates retain stronger inside biases during drier periods. Observers tracking these trends across 2026 note that rail movements implemented for safety or maintenance reasons can temporarily invert established draw patterns until the new position stabilises.
Conclusion
Comprehensive charting of rail draw impacts requires integration of track geometry, surface data and sectional timing across independent flat circuits. The evidence assembled from multiple jurisdictions demonstrates that draw position exerts measurable influence on sprint outcomes, yet the magnitude of that influence varies with specific course features and prevailing conditions. Continued collection of granular performance records will refine existing models and support more precise evaluation of each runner's chances based on its allocated post position.