Analyzing Risk Tolerance Across Poker Player Archetypes
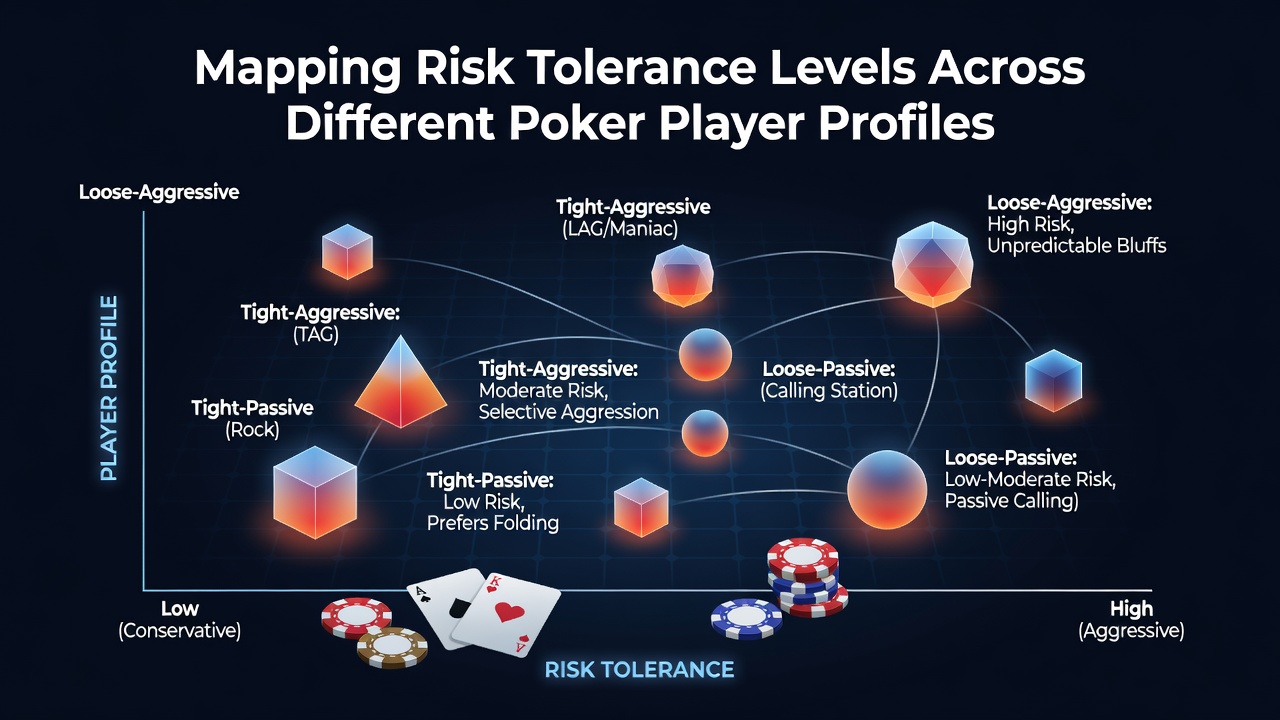
Researchers have examined how different poker player profiles display distinct risk tolerance patterns that influence decision-making at the tables, and data from multiple studies continue to highlight these variations in detail. Observers note that risk tolerance refers to the willingness of players to accept uncertain outcomes for potential gains, a factor that separates conservative approaches from aggressive ones in both cash games and tournaments.
Core Concepts Behind Risk Mapping
Experts define risk tolerance through measurable behaviors such as bet sizing, frequency of bluffs, and responses to variance, while studies separate these traits into categories that align with established playing styles. Data indicates that players with low risk tolerance tend to minimize exposure during marginal spots, whereas those with higher thresholds pursue larger edges even when variance increases. Research from the Canadian Centre on Substance Use and Addiction has tracked these patterns across thousands of hands, revealing consistent clusters that emerge regardless of stakes or format.
One study revealed that participants who classify as tight players fold more than 75 percent of starting hands in early position, a choice that reflects measured risk assessment rather than avoidance. In contrast, loose profiles enter pots with a wider range, accepting greater uncertainty in exchange for implied odds and positional advantages. Those who've analyzed tournament data find that risk tolerance often shifts during different stages, with players tightening up near pay jumps and expanding ranges when short-stacked.
Profiles and Their Documented Patterns
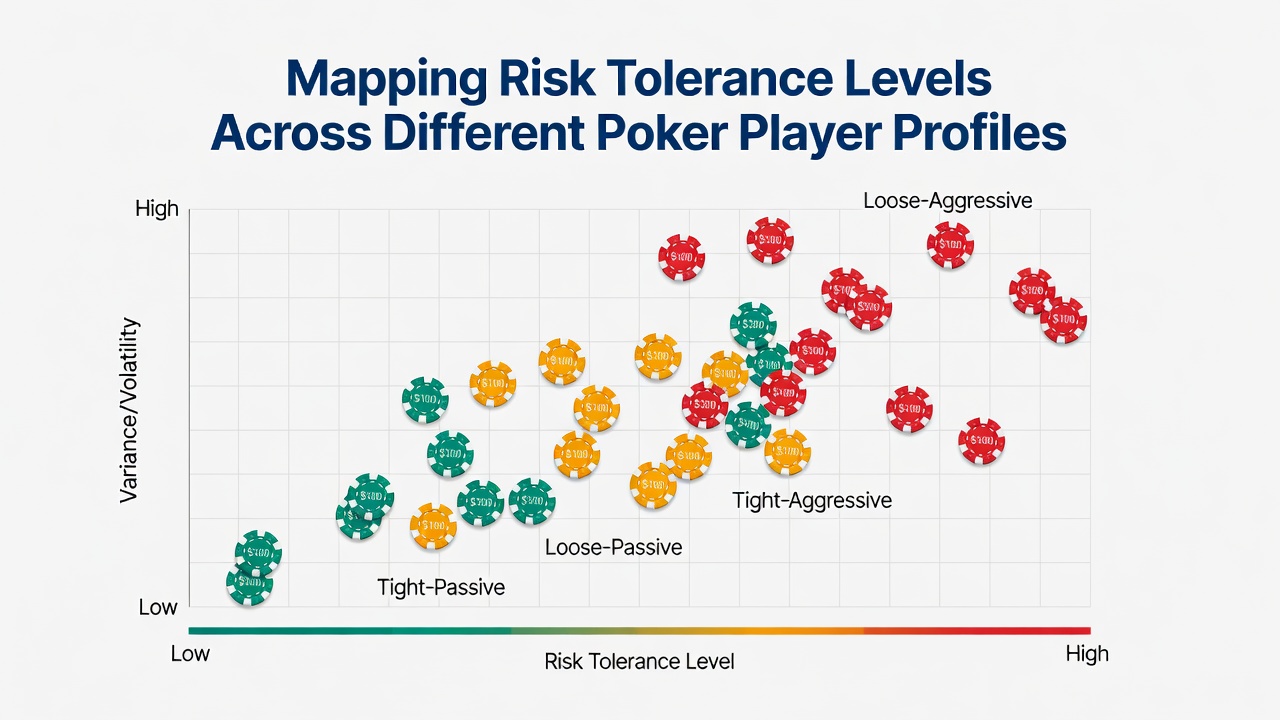
Four primary archetypes receive the most attention in current research, each carrying predictable risk signatures. Tight-aggressive players combine selective hand ranges with assertive post-flop action, producing moderate risk tolerance that spikes only when equity calculations support larger commitments. Loose-aggressive profiles demonstrate elevated tolerance through frequent three-bets and barreling, accepting higher loss rates in pursuit of fold equity across multiple streets.
Tight-passive participants show the lowest tolerance overall, calling frequently but rarely raising, which leads to passive lines that cap potential losses yet also limit upside. Loose-passive players enter many pots yet rarely apply pressure, creating a profile where risk tolerance remains high for initial investments but drops sharply once committed. Evidence suggests these patterns hold across both online and live settings, although live games sometimes amplify emotional factors that alter baseline tolerance levels.
Quantitative Findings From Recent Analyses
Figures released in June 2026 from the Nevada Gaming Control Board highlighted participation trends that intersect with risk behavior studies, showing continued growth in mid-stakes cash games where profile diversity remains widest. Academic papers from the University of Sydney's Gambling Treatment and Research Centre have mapped risk scores using standardized questionnaires paired with hand histories, producing datasets that correlate tolerance levels with long-term return rates.
What's interesting is how position and stack depth interact with these archetypes. Researchers discovered that tight-aggressive players adjust risk exposure more fluidly than others, reducing aggression when out of position while maintaining core ranges. Loose-aggressive counterparts maintain higher variance regardless of position, a trait that produces larger swings but also bigger winning sessions when timing aligns.
Strategic Adjustments and External Influences
Coaches and analysts observe that understanding these mapped profiles allows for targeted exploitation, such as increasing pressure against low-tolerance opponents who fold too often to aggression. Data shows that players who recognize their own risk patterns can adjust bet sizing and frequency to match table dynamics more effectively. External factors including recent results, table image, and remaining stack sizes further modulate tolerance, creating temporary deviations from baseline profiles.
Industry reports from the European Gaming and Betting Association note rising interest in tools that track personal risk metrics over time, helping participants identify when their decisions stray from established patterns. Those who've reviewed large sample sizes find that consistent application of risk-appropriate strategies correlates with steadier results, whereas frequent deviations often precede downswings. And yet the same datasets reveal that even high-tolerance players reduce exposure during prolonged losing periods, demonstrating that experience can recalibrate baseline tendencies.
Conclusion
Mapping risk tolerance across poker player profiles provides a framework that researchers and participants alike use to interpret decision patterns more precisely. Continued data collection from regulatory bodies and academic institutions supports ongoing refinement of these models, while real-time tracking tools offer practical applications at the tables. The patterns remain stable enough to guide strategy yet flexible enough to accommodate individual variation and situational adjustments.